
By Constance Hallemeier
Data points to grades, data leads to teacher effectiveness, data outlines district capabilities, data, data, data. It’s everywhere, but there is so much of it. How do we identify what is useful and what will lead to beneficial changes in the classroom, the school, and the district? We’ve probably all heard of school districts that are “data rich, but information poor.” The push to be data-driven has led to collecting more and more data, but we shouldn’t collect data just for the sake of collecting it. We should have a purpose and mindset behind the data we collect and what we do with it.
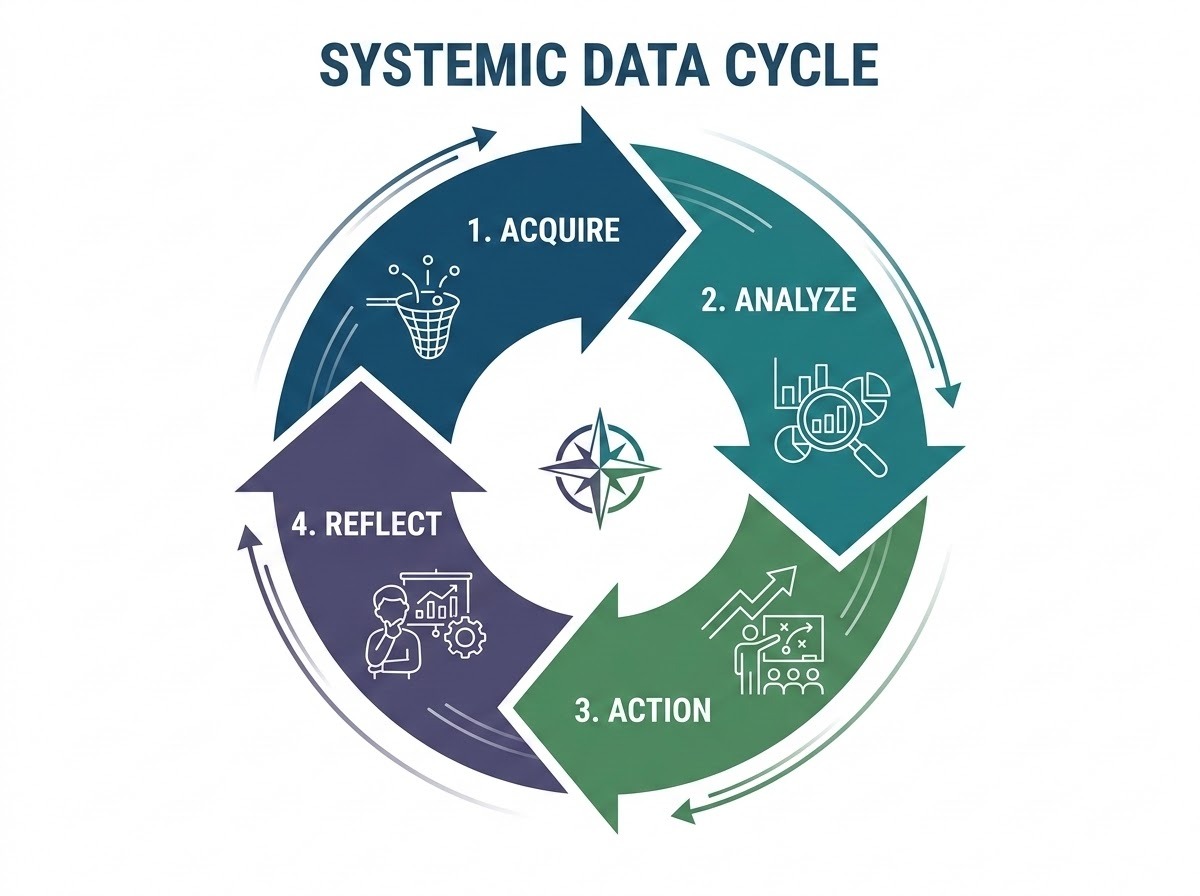
Data falls into two categories: qualitative and quantitative. Both types of data can lead to different discussions and different outcomes for a classroom, a building, or a district. Quantitative data measures what is happening, while qualitative data helps explain why and how it is happening. Knowing when each is beneficial, how much data to collect, and what to do with it is key, along with a systemic data cycle: acquire, analyze, action, reflect.
Transforming the Culture
Before we can demystify data and identify shifts in how we use it, we need a mindset shift that will sustain growth in our classrooms, schools, and districts.
From Data-Driven to Data-Informed
Data-driven implies being pushed by the numbers to make snap decisions. Data-informed means being guided by the insights the numbers provide. When a system is strictly data-driven, human judgment takes a backseat to the numbers; no investigation about the how or the why enters the picture. Aaron Hepburn highlights the importance of looking for patterns in the data over three years in his blog, "What Proficiency Alone Will Never Tell You."
Humanizing the Numbers
Taking the concept of data-informed to the next level, we need to look beyond the spreadsheets. Behind every cell in a spreadsheet is a student navigating a unique developmental journey. A single test score reflects a snapshot in time influenced by sleep, stress, home language, and test anxiety. We need to convert the scores into stories of real student experiences. A drop in reading comprehension scores isn’t just a low percentile. Digging deeper could reveal a student struggling with decoding, lacking background knowledge, or experiencing stressors at home.
To move from data-driven to data-informed and humanize the numbers, teachers and administrators need to decide which type of data is most valuable. Sustainable school improvement utilizes both qualitative and quantitative data.
|
Educational Data |
|||
|
Data Type |
Primary Role |
Examples |
Educational Insight |
|
Quantitative |
Measures what is happening |
Universal screeners, benchmark assessments, attendance rates, graduation rates, behavioral referrals |
Identifies trends, discrepancies, gaps, and surface-level patterns |
|
Qualitative |
Explains why and how it is happening |
Student voice, empathy interviews, classroom observations, exit tickets, focus groups |
Reveals underlying root causes, motivation, climate, and instructional needs |
What are the shifts in how to use data?
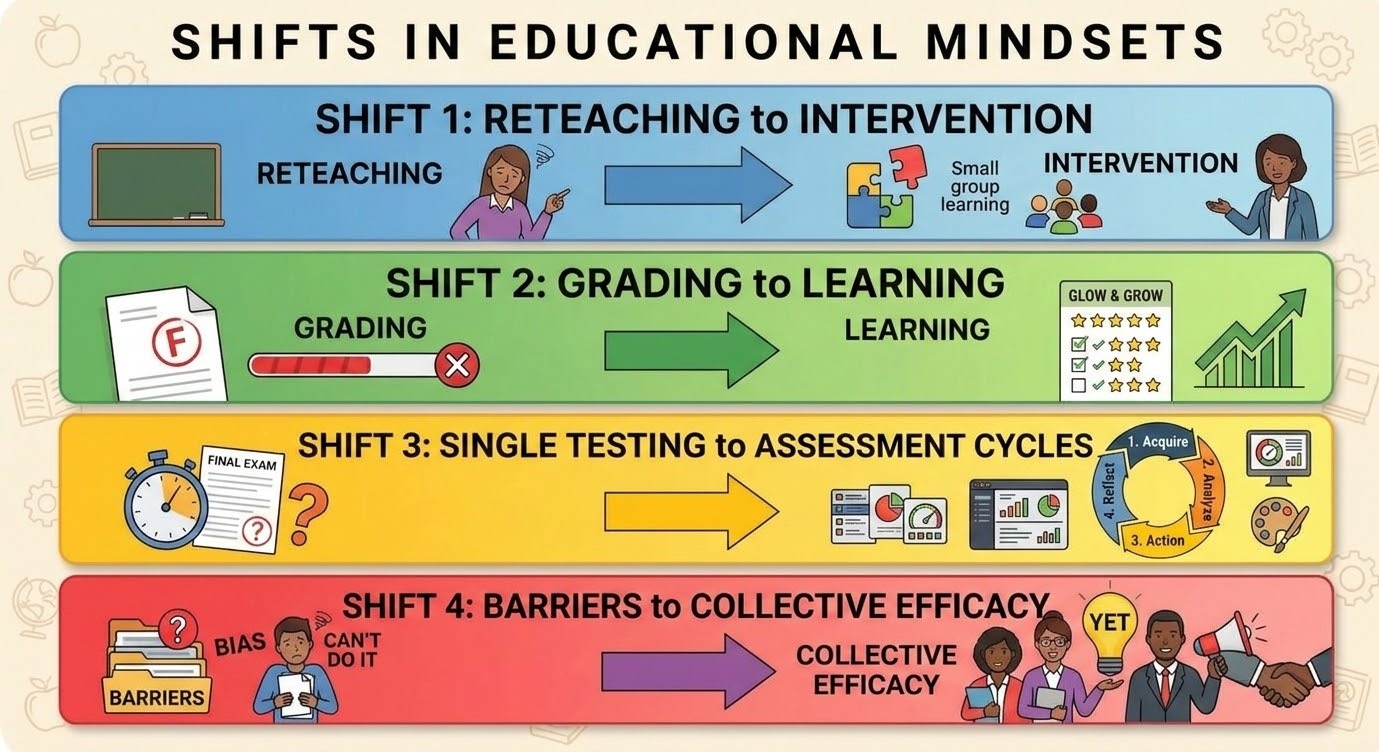
From Reteaching to Intervention

One of my favorite data protocols is sorting student work. As a collective group, we would sort student work into “like” piles. Then, we would call students who earned the lowest scores into a group to reteach the skill. However, sorting stopped at basic diagnostic sorting, identifying what was missed and assigning a teacher to reteach it. Simply re-explaining the same lesson (slower and louder) to struggling students rarely produces long-term retention.
Work sorting isn’t a poor data protocol. But after sorting the work, instead of just reteaching the material, identify why students missed certain material. Then, alter the instruction to help students master the content. Using quantitative data to identify learning gaps becomes valuable classroom information.
An example
Consider a math classroom working through solving two-step equations. In a “targeted reteaching” model, a teacher sees that 60% of the students failed the quiz. Targeted reteaching would involve pulling those 60% of students into a small group and repeating the algorithm steps for solving two-step equations: use the inverse operation for addition and subtraction first, then the inverse operation for multiplication and division second.
Responsive intervention analyzes the student work qualitatively to uncover the misconceptions. Instead of just repeating the algorithm, the teacher shifts to a conceptual model for solving the two-step equations. Data transforms from a diagnostic list into pedagogical growth. This approach humanizes the data and leads to informed decision-making in the classroom.
From Grading to Learning

“Is this going to be on the test?” I heard this too many times as a teacher. I wanted my students to learn, not just collect points on a test. However, data-driven instruction led me to emphasize points, and students tried to collect them even if they didn’t master the skills. Students would take a quiz or test, get a score, and move on to the next skill without reflecting on what they missed and why.
Working with a district through Compass PD has given me the opportunity to practice these things outside of my classroom. While I knew from personal experience that actionable feedback worked, I often wondered if its success stemmed from the strategy itself or simply the deep relationships I had built with my own students. Being able to work alongside another teacher and have similar results solidifies how powerful this can be. This feedback opened doors for dialogue with their students about their learning, where they are in a progression of learning, and guiding them to mastery of content, not just points in the gradebook. Students viewed their work as an opportunity to identify successes and mistakes, and teachers used observational data to move learning forward in their classrooms.
An example
Consider a 9th grade ELA classroom where students turn in an essay assignment. They receive the essay back with a grade on top or a scoring guide with a grade on it. Students look at the grade, excited that they did well or defeated that they didn’t. They shove the papers into their backpacks or close the tab on their device, never considering the feedback like the grade is final. Students feel like they can’t make corrections, and they don't learn from their mistakes.
In another 9th grade ELA classroom, one week before the essay due date, the teacher invites students to share their essays with others or self-assess using the scoring guide. Students can use the data to guide their learning, correct mistakes, and make corrections prior to the final draft. This approach uses quantitative data to highlight instructional needs.
From Single Testing to Assessment Cycles

“I know what my students are going to do on an assessment before they take it.” This is the ideal situation for a teacher. Performance on assessments at the end of a unit, quarter, or semester shouldn’t be a surprise if teachers move from isolated testing to a strategic assessment cycle. Every assessment can inform tomorrow’s instruction or evaluate yesterday’s learning, depending on when and how the data is used. Teachers constantly collect data, analyze it, take action based on it, and reflect on changes. Rather than relying on end-of-unit or end-of-year summative assessments, effective systems use three levels of assessment: short-cycle, medium-cycle, and long-cycle.
- Short-Cycle Assessments: These are daily or in-the-moment assessments like response cards, exit tickets, or whiteboard answers that are useful at the classroom level.
- Medium-Cycle Assessments: These are weekly or monthly assessments, including unit pre/post assessments and common formative assessments designed by grade-level teams, that are useful at the building level.
- Long-Cycle Assessments: These assessments are annual tests, like state standardized tests and universal screeners, that are useful at the district level.
An Example
Consider teaching fractions in 4th grade.
- At the classroom level, a teacher may give an exit ticket to instantly review for targeted reteaching or enrichment during center time the next morning.
- At the building level, the 4th grade teachers bring their common formative assessment about fractions to their collaboration time. This evaluation allows the team to identify which classrooms have mastered the concepts, adjust upcoming instructional pacing, and share successful teaching strategies.
- At the district level, the administrative team evaluates state standardized test scores to determine district-wide proficiency, allocate intervention resources, evaluate curriculum efficacy, and plan professional development.
From Barriers to Collective Efficacy

Data can be intimidating and cumbersome if we allow it to be. Collecting data to check a box creates compliance, but true system transformation happens when data becomes a collaborative tool for collective efficacy. According to John Hattie, collective efficacy has an effect size of 1.57, making it one of the top two largest impacts on learning. Fostering a culture of collective efficacy requires creating a safe environment where teachers can expose instructional vulnerabilities without fear of poor performance evaluations or ridicule from other teachers.
An example
Consider a science classroom learning about parts of a cell. Four different teachers give a quiz on the content and discuss the outcomes. Each states the mean, median, and mode scores for their students' quizzes. One teacher’s students did quite well, and another teacher’s students didn’t. “My students didn’t pay attention when I was teaching.” “My students didn’t study enough.” “My students . . . .” Excuses become the conversation.
However, if the conversation focused on student success, the quizzes would be viewed as a whole to determine which instructional strategies were effective for different students. Teachers could share classroom videos of lessons on the parts of a cell, and the data would shift from an evaluative threat to shared professional growth, building collective efficacy.
Leadership Support
To put these shifts into practice, educational leaders should follow best practices to build a sustainable, data-informed culture:
- Start simple
- Set specific targets
- Use a data cycle
- Protect collaborative team time
- Make data sharing easy
Demystifying Data: The Path Forward
Schools have the data; now let’s just use it. Let’s be data-rich and information-productive.
By shifting our focus from targeted reteaching to responsive intervening, we allow numbers to change our practice, not just our student groupings. Moving from grading to guiding restores student agency, transforming passive scorekeeping into an active partnership. Aligning our assessment cycles turns fragmented testing into a continuous, coherent story of student growth. Finally, replacing administrative compliance with a culture of collective efficacy ensures educators can analyze student work openly, without fear or defensiveness.
When we embrace these four shifts, data stops being an overwhelming administrative burden. It becomes what it was always meant to be: a compass to help point the way toward equitable instruction, professional growth, and real student mastery.
References
Brasel, J., Garner, B., Kane, B., & Horn, I. (2015, November 1). Getting to the Why and How. ISTE/ASCD. Retrieved September 1, 2026, from https://www.ascd.org/el/articles/getting-to-the-why-and-how
Brown, R., & Adato, M. (2020, August 14). Data-based decision making in education. Renaissance. Retrieved September 2, 2026, from https://www.renaissance.com/blog/data-driven-decision-making-in-education-why-its-needed-and-how-to-use-it/#blog-main-header-3
Data Rich, Information Poor: How K12 Data and Analytics Can Improve Student Outcomes. (n.d.). ECRAGroup. Retrieved September 1, 2026, from https://ecragroup.com/2023/05/19/data-rich-information-poor-how-k12-data-and-analytics-can-improve-student-outcomes/
Fisher, D., & Frey, N. (2025, September 1). Collecting Evidence of Learning. ISTE/ASCD. Retrieved September 1, 2026, from https://ascd.org/el/articles/collecting-evidence-of-learning
Fisher, D., & Frey, N. (2025, December 1). From Grading to Guiding. ISTE/ASCD. Retrieved September 1, 2026, from https://www.ascd.org/el/articles/from-grading-to-guiding
Hattie, J. (n.d.). Hattie effect size list - 256 Influences Related To Achievement. Visible Learning. Retrieved September 4, 2026, from https://visible-learning.org/hattie-ranking-influences-effect-sizes-learning-achievement/
Hunter, K. (2025, December 1). Make the Most of Classroom Data. Discovery Education. Retrieved September 1, 2026, from https://www.discoveryeducation.com/blog/educational-leadership/using-data/
Vilen, A. (2019, March 1). Data-Driven Instructional Leadership. ISTE/ASCD. Retrieved September 1, 2026, from https://www.ascd.org/el/articles/data-driven-instructional-leadership
About the Author